Observing K8s clusters with OpenTelemetry
Introduction to OpenTelemetry:
OpenTelemetry, a.k.a. OTel, is a key part of observability since it allows you to collect traces, metrics, and logs from your systems to help you understand why issues may be happening. This is crucial, especially in complex microservices and cloud-native systems, where human beings can’t track every single transaction traversing your architecture.
However, it is not a backend solution like Prometheus or Jaeger (more to that in the next section). It’s open source and vendor-neutral, with an active and thriving community.
Its name was born as a combination of two words:
- Open = open source
- Telemetry = coming from Greek
Tele = remote
Metry = measurements
OpenTelemetry was born from the merger of two already-existing open-source projects, OpenTracing and OpenCensus, both created to support gathering traces and metrics. OpenTelemetry is backward compatible with all integrations from both projects.
Why OpenTelemetry?
There are already multiple observability platforms that can provide a drill down in your code and show you traces (like Dynatrace, NewRelic, DataDog, etc.) – so why do you need OpenTelemetry?
“OpenTelemetry resolves one big pain: creating a standard to report and transmit measurements”.
If you use OpenTelemetry with solution A, you can easily change your observability platform to solution B. Without losing any history of your traces.
Now, OpenTelemetry has become the standard for many companies that are implementing observability in their systems.
OpenTelemetry components:
Now, let’s look at the components that are part of OpenTelemetry.
OpenTelemetry Collector:
The OpenTelemetry Collector offers a vendor-agnostic implementation of how to receive, process and export telemetry data. It removes the need to run, operate, and maintain multiple agents/collectors.
The collector is not required, but it is very flexible in deployment. You can either deploy it as an agent or as a gateway. The difference is that as an agent, the collector instance runs with the application on the same host (sidecar container, daemonset …etc.). One or more collector instances run as a gateway as standalone services per cluster, datacert, and region.
It’s recommended to choose the agent deployment for new applications and use the gateway deployment for existing ones. In the case of Kubernetes, it will be deployed as a daemonset (agent mode).
The collector comprises three components that are enabled through a pipeline:
- Receiver to get data into the collector, sent by either push or pull
- Processor to decide what to do with the data received
- Exporter to decide where to send the data, done by either pull or push.
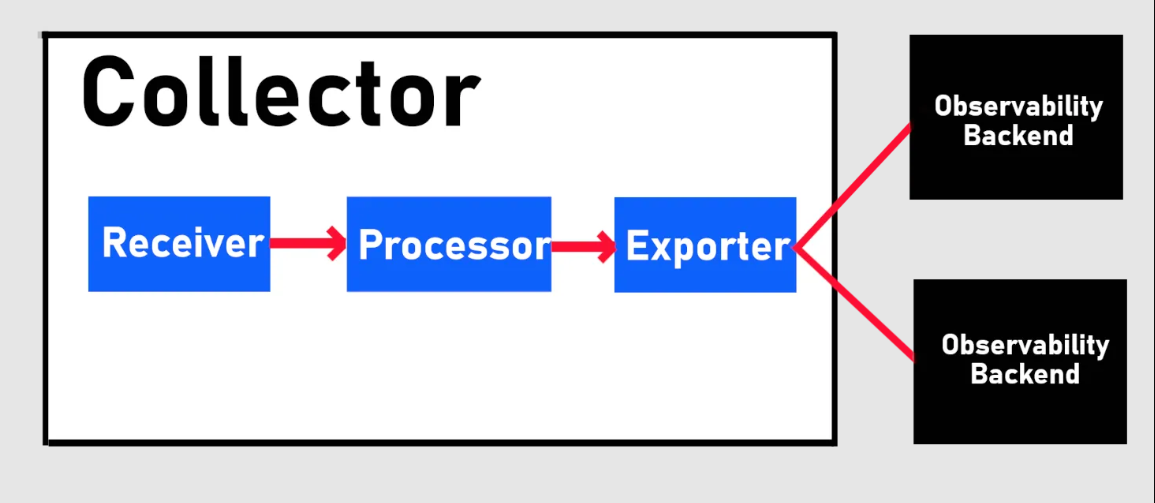
The Collector requires you to build a pipeline for each signal (traces, metrics, logs, etc.)
Like the agent log Collector, the Collector pipeline is a sequence of tasks starting with a receiver, then a processing sequence, and then the last sequence to forward the measurements with the exporter sequence.
The OpenTelemetry Collector also provides extensions. They’re generally used for implementing components that can be added to the Collector but don’t require direct access to telemetry data.
Each pipeline step comprises an operator that’s part of the Collector core or from the contrib repository. In the end, you’ll use the operator provided by the release of the Collector.
Every plugin supports one or more signals, so make sure that the one you’d like to use supports traces, metrics, or logs.
Designing a pipeline
Designing your pipeline is very simple. First, you need to declare your various receivers, processors, and exporters, as follows:
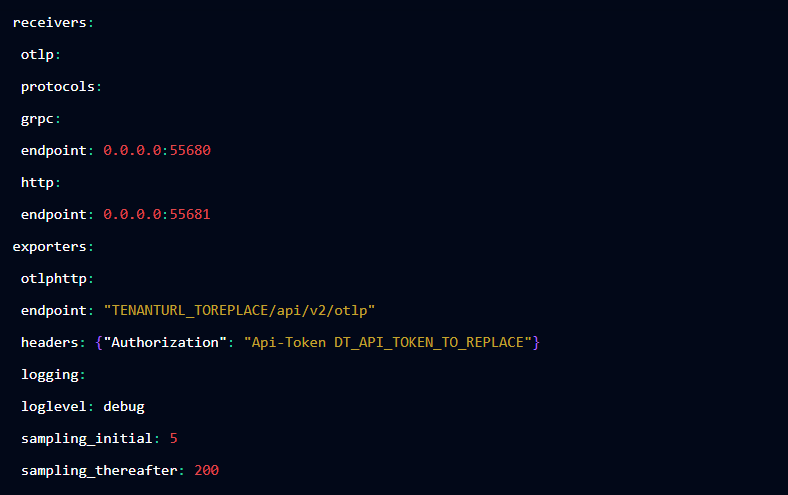
In this example, we only define one receiver, OTLP, and two exporters, OTLP/HTTP and logging.
Then, you need to define the actual flow of each signal pipeline:

The core components of the OpenTelemetry Collector:
The core components of the OpenTelemetry Collector include a few plugins that help you build your pipeline. The contrib Collector includes the core features of the OpenTelemetry Collector.
Receiver
The core Collector has only one available receiver for the data source: the standard OpenTelemetry protocol for traces, metrics, and logs.
To define your Otlp receiver, you need to define:

The Collector will bind a local port on the Collector to listen for incoming data. The default port for grp is 4317, and the default port for HTTP is 4318.
The receiver has the property CORS (Cross-origin Resource Sharing). Here, we can white label the origins allowed to send requests and the allowed headers.

Processor
The core Collector also includes a few processors that modify the data before exporting it by adding attributes, batching, deleting data, etc. No processors are enabled by default in your pipeline. Every processor supports all or a few data sources (traces, logs, etc.), and the processor’s order is important.
The community recommends using the following orders:
Traces:
- memory_limiter
- any sampling processors
- Any processor relying on sending source from Context (e.g. k8sattributes)
- batch
- any other processors
Metrics:
- memory_limiter
- Any processor relying on sending source from Context (e.g. k8sattributes)
- batch
- any other processors
The core Collector provides only two types of operations for the processor: the batch processor and the memory limiter processor.
Memory limiter processor
The memory limiter is a crucial component of all our pipelines of all types of data sources. It is recommended to be one of the first steps after receiving the data.
Memory limit controls how much memory is used to avoid facing out-of-memory situations. It uses both soft and hard limits.
When the memory usage exceeds the soft limit, the Collector will drop data and return the error to the previous step of the pipeline (normally the receiver).
If the memory is above the hard limit, then the processor will force the garbage Collector to free some memory. That will cause data to be dropped. When the memory drops and goes back to normal, the operation is resumed, with no data dropped and no GC.
The soft limit is calculated according to two parameters: hard limit – spike limit. This means that you can’t change it in the settings.
Some more critical parameters are:
- Check limit: (default value = 0, recommended value = 1) the time between two measurements of the memory usage.
- Limit_mib: the maximum amount of memory in MiB. This defines the hard limit.
- Spike_limit_mib: (default value = 20% of limit_mib). The maximum spike that’s expected between the measurements. The value must be less than the hard limit.
- Limit_percentage: the hard limit defined by taking a % of the total available memory.
- Spike_limit_percentage
Batch processor
The batch processor supports all data sources and places the data into batches. Batching is important because it compresses the data and reduces the number of outgoing connections sent.
As explained previously, the batch processor must be added to all your pipelines after any sampling processor.
The batching operator has several parameters:
- Send_batch_size: the number of spans, metrics, and logs in a batch that would be sent to the exporter (default value = 8192)
- Timeout: time duration after each data transfer (default = 200ms)
- Send_batch_max_size: the upper limit of the batch size (0 means no upper limit).
Exporters:
There are three default exporters in the OpenTelemetry Collector: OTLP/HTTP, OTLP/gRPC, and Logging.
OTLP/HTTP
OTLP/HTTP has only one required parameter, the Endpoint, which is the target URL to send your data. For each signal, the Collector will add:
- /v1/traces for traces
- /v1/metrics for metrics
- And /v1/logs for logs.
There are also some optional parameters:
- Traces_endpoint: if you want to customize the URL without having the Collector add/v1/traces, then you should use this setting
- Metrics_endpoint
- Logs_endpoint
OTLP/gRPC
OTLP/gRPC has fewer parameters: Endpoint and TLS
Grpc also compresses the content in gzip. If you want to disable it, you can add:
Compression: none
The OTLP/gRPC has support for proxy by adding the environment variables:
- HTTP _PROXY
- HTTPS_PROXY
- NO_PROXY
Logging
Logging is an operator that you’ll probably use to debug your pipelines. It accepts a couple of parameters:
- Logging_lebel: (default info)
- Sampling_initial: number of messages initially logged each second.
The components from the contrib repo:
The OpenTelemetry Collector Contrib provides many plugins, but it wouldn’t be useful to describe all of them. Here, we will only look at the receivers, the exporters, and the processors.
Receiver
Receivers are crucial because they can connect to a third-party solution and collect measurements from it.
We can almost separate the receivers into 2 categories: listening mode and polling mode. You can find a complete list here: OpenTelemetry-collector-contrib repository
Here are some examples of receivers:
Most receivers for traces are in listening mode, for example:
- AWS X-Ray
- Google PUbSub
- Jaeger
- Etc.
For metrics, there are fewer listening plugins. Here are a few of them:
- CollectD
- Expvar
- Kafka
- OpenCencus
- Etc.
On the other side, there is a larger number of receivers working in polling mode like:
- Apache
- AWS Container Insights
- Cloud Foundry Receiver
- CouchDB
- Elasticsearch
- flinkMetrics
- Etc.
We could be interested in all the database receivers, webservers, broker technology, and OS from this list. But also kubelet, k8scluster, Prometheus, and hostmetrics.
In terms of logs, there are few operators available, mainly acting in listening mode:
- fluentForward
- Google PUbSub
- journald
- Kafka
- SignalFx
- splunkHEC
- tcplog
- udplog
And fewer acting in polling mode:
- filelog
- k8sevent
- windowsevent
- MongoDB Atlas
Processors
The Collector Contrib provides various processors that help you modify the structure of the data with the help of attributes (adding, updating, deleting), k8sattrributes, resource detection, and resources (updating/deleting resource attributes). All those processors support all existing signals.
Then you have a specific processor for trades that helps you adjust the sampling decisions (probability sampler or tailsampling) or to group your traces (with groupbytraces). For metrics, two specific processors help you make operations: cumulative to delta and delta operator. An interesting processor exposes observability metrics related to our spans that deserve to be tested, as it could help you count the span per latency buckets: spanmetrics.
In the end, you’ll probably use frequently these processors:
- Transform
- Attributes
- K8sattrributes
Extensions
The Collector contrib provides more extensions to the Collector. We can split them into various categories:
Extensions handling the authentication mechanism to the receivers or exports
- Asapauth
- Basicauth
- Beartokenauth
- Oauth2auth
- Oidauth
- Sigv4auth
Extensions for operations
- Httphealthcheck: provides an HTTP endpoint that could be used with k8s with liveness or readiness probe
- Prof: to generate profiling out of the Collector
- Storage: storing the data’s state into a DB or a file
Extensions for sampling:
- jaegerremotesampling
And then you have a very powerful extension: observer.
The observer helps you discover networked endpoints like a Kubernetes pod, Docker container, or local listening port. Other components can subscribe to an observer instance to be notified of endpoints coming and going. Observers usually use few receivers to adjust how data is collected based on incoming information.
How to observe k8S using the Collector contrib:
With all those operators, the big question is: can we observe our K8S cluster using only the Collector?
One option would be to use Prometheus exporters and the receiver to scrape the metrics directly from them. But we don’t want to use the Prometheus exporter in our case; instead, we will try to find a way to use the Collector operator designed for Kubernetes.
Receivers collecting metrics:
- k8Scluster
- Kubelet
- Hostmetrics
Receivers collecting logs:
- Kubernetes events
A few processors:
- memory_limiter and batch
- k8sattributes
- transform
Let’s first look at the various receivers we’re going to use.
The receivers
k8Scluster
K8scluster collects cluster-level metrics from the k8s API. This receiver will require you to have specific rights to collect data, and it provides a different way to handle the authentication:
- A service account (default mode) will require creating a service account with a clusterRole to read and list most of the Kubernetes objects of the cluster
- A Kubeconfig to map the kubeconfig file to be able to interact with the k8s API.
The receiver has several optional parameters:
- Collection_interval
- Node_codition_to_report
- Distribution: OpenShift or Kubernetes
- Allocatable_types_to_report: could specify the type of data we’re interested in (CPU, memory, ephemeral storage, storage)
This plugin generates data with resource attributes, so if your observability solution is not supporting resource attributes in the metrics, make sure to convert resource attributes into labels.
Kubelet Stats receiver
The Kubelet Stats receiver interacts with the kubelet API exposed on each node. To interact with kubelet you’ll need to handle the authentication using TLS settings or with the help of a service account.
If using a service account, give the right list/watch rights to most of the Kubernetes objects.
Because this receiver requires the node’s information, you can utilize an environment variable in the Collector to specify the node:
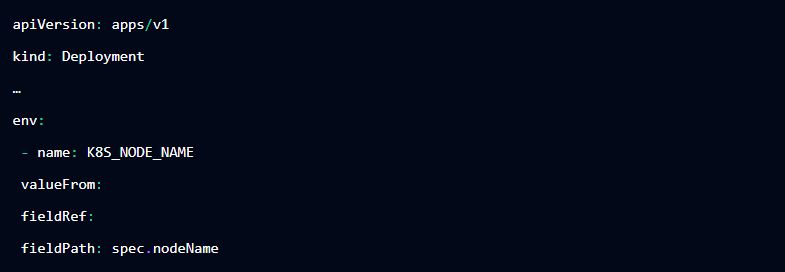
And then

Or we could also combine it with the powerful extension “observe.” For example:

In this example, the endpoint and kubelet_endpoint_port will be provided by the observer.
Then we could add extra metadata using the parameters extra_metadata_labels and metric_group to specify which metrics should be collected. By default, it will collect metrics from containers, pods, and nodes, but you can also add volume.
To get more details on the usage of the nodes at the host level, you could also use the Hostmetrics receiver.
Kubernetes event receiver
The Kubernetes event receiver collects events from the k8s API and creates OpenTelemetry logs data. Similar to the previous receivers, you’ll need specific rights and can authenticate using Kubeconfig or serviceaccount.
This receiver also offers the ability to filter the events for specific namespaces with namespaces parameter. By default, it is set to all.
The processors
Now, let’s look at the processors we’re going to use.
k8Sattributes
The K8sattributes processor will be used to add extra labels to our k8s data.
This processor collects information by interacting with the Kubernetes API. Therefore, similarly to the previous operator, you’ll need authentication using serviceaccount or Kubeconfig.
You can specify extra labels you may want to use using the extract operator :
For example :

MetricTransform
The MetricTransform processor helps you to:
- Rename metrics
- Add labels
- Rename labels
- Delete data points
- And more.
In our case, we would use this processor to add an extra label with the cluster ID and name to all the reported metrics. This label would be crucial to help us filter/split data from several clusters.
Last, we won’t describe exporters, but you’ll need to use one exporter for the produced metrics and one for the generated logs.
Implementation:
Step1: Installation of various tools on our machine.
The following tools need to be install on your machine :
- jq
- kubectl
- git
- Helm
Step2: Clone the GitHub Repository.
GitHub : How to observe your K8s cluster using OpenTelemetry.
git clone https://github.com/isItObservable/Otel-Collector-Observek8s.git cd Otel-Collector-Observek8s
This repository showcase the usage of the OpenTelemtry Collector with :
- the HipsterShop ( a Demo Application)
- K6 ( to generate load in the background)
- The OpenTelemetry Operator
- Nginx ingress controller
- Prometheus
- Loki
- Grafana
Step3: Connect to your K8s cluster.
aws eks update-kubeconfig –region <region_name> –name <cluster_name>
Step4: Deploy Nginx Ingress Controller with the Prometheus exporter.
helm upgrade –install ingress-nginx ingress-nginx –repo https://kubernetes.github.io/ingress-nginx –namespace ingress-nginx –create-namespace
get the ip adress of the ingress gateway:
Since we are using Ingress controller to route the traffic , we will need to get the public ip adress of our ingress. With the public ip , we would be able to update the deployment of the ingress for :
- hipstershop
- grafana
IP=$(kubectl get svc ingress-nginx-controller -n ingress-nginx -ojson | jq -j ‘.status.loadBalancer.ingress[].ip’)
Update the manifest files.
update the following files to update the ingress definitions:
sed -i “s,IP_TO_REPLACE,$IP,” kubernetes-manifests/k8s-manifest.yaml
sed -i “s,IP_TO_REPLACE,$IP,” grafana/ingress.yaml
Step5: Deploy OpenTelemetry Operator.
- Cert-Manager
The OpenTelemetry operator requires to deploy the Cert-manager:
kubectl apply -f https://github.com/cert-manager/cert-manager/releases/download/v1.8.2/cert-manager.yaml
- OpenTelemetry Operator
kubectl apply -f https://github.com/open-telemetry/opentelemetry-operator/releases/latest/download/opentelemetry-operator.yaml
Step6: Deploy the demo application.
kubectl create ns hipster-shop
kubectl apply -f kubernetes-manifests/k8s-manifest.yaml -n hipster-shop
Step7: Prometheus without any exporters
- Deploy Prometheus
helm repo add prometheus-community https://prometheus-community.github.io/helm-charts
helm repo update
helm install prometheus prometheus-community/kube-prometheus-stack –set kubeStateMetrics.enabled=false –set nodeExporter.enabled=false –set kubelet.enabled=false –set kubeApiServer.enabled=false –set kubeControllerManager.enabled=false –set coreDns.enabled=false –set kubeDns.enabled=false –set kubeEtcd.enabled=false –set kubeScheduler.enabled=false –set kubeProxy.enabled=false –set sidecar.datasources.label=grafana_datasource –set sidecar.datasources.labelValue=”1″ –set sidecar.dashboards.enabled=true
- Enable remote Writer
To be able to send the Collector metrics to Prometheus , we need to enable the remote writer feature.
To enable this feature we will need to edit the CRD containing all the settings of promethes: prometehus
To get the Prometheus object named use by Prometheus we need to run the following command:
kubectl get Prometheus
here is the expected output:
NAME VERSION REPLICAS AGE
prometheus-kube-prometheus-prometheus v2.32.1 1 22h
We will need to add an extra property in the configuration object:
enableFeatures:
– remote-write-receiver
so to update the object:
kubectl edit Prometheus prometheus-kube-prometheus-prometheus
- Deploy the Grafana ingress
kubectl apply -f grafana/ingress.yaml
Step8: Deploy Loki without any log agents
kubectl create ns loki
helm upgrade –install loki grafana/loki –namespace loki
kubectl wait pod -n loki -l app=loki –for=condition=Ready –timeout=2m
LOKI_SERVICE=$(kubectl get svc -l app=loki -n loki -o jsonpath=”{.items[0].metadata.name}”)
sed -i “s,LOKI_TO_REPLACE,$LOKI_SERVICE,” otelemetry/openTelemetry.yaml
Step9: Collector pipeline
- Create the service Account
kubectl apply -f otelemetry/rbac.yaml
- Update Collector pipeline
CLUSTERID=$(kubectl get namespace kube-system -o jsonpath='{.metadata.uid}’)
CLUSTERNAME=”YOUR OWN NAME”
sed -i “s,CLUSTER_ID_TO_REPLACE,$CLUSTERID,” otelemetry/openTelemetry.yaml
sed -i “s,CLUSTER_NAME_TO_REPLACE,$CLUSTERNAME,” otelemetry/openTelemetry.yaml
- Deploy the collector pipeline
kubectl apply -f otelemetry/openTelemetry.yaml
Step10: Open Grafana in a browser.
Here we can create the dashboards for various metrics.

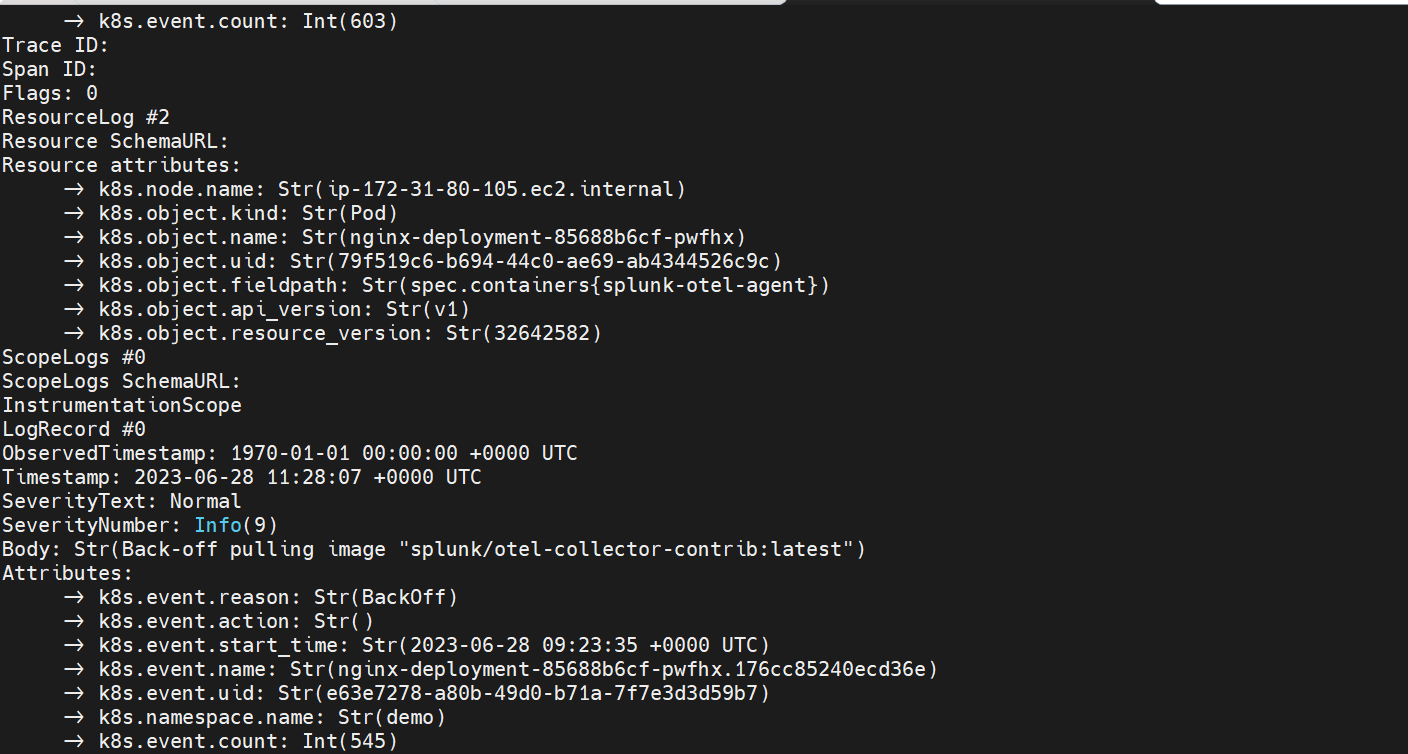
Logs from EKS cluster
